"You had better believe it for there are no certainties in this
investment world, and where you have no certainties,
you should begin by understanding yourself."
-James L. Fraser
Many people might had considered that the stock market is a dangerous place, and think that participate in the market is a "Gamble". They would rather be safe than sorry... So, they might just keep their money in the "Safe places", like keep in fix deposit with banks or entrust fund managers to take care of their hard-earned money.. Then, they would just concentrate to work harder in their job. This approach had been proven, repeatedly, in the history that why 95%public still cannot achieve Financial Freedom at the age of 65.
In fact, many things in life are more or less a gamble... Such as, choosing to work for which companies is a gamble; marriage is a gamble, etc.
While some gambles with calculated risk and vision can surely lead to winning towards the end, while there some gambles are sure to loose eventually... Such as ignore personal financial matters; Vote for a new president to solve financial issue, etc...
So, for those who try to completely avoid the stock market and not putting any effort to learn about it... is also a form of gambling, and they are gambling big time! Just that they might not aware of the seriousness at this moment. :-)
In actual fact, in my view, the market can be so dangerous is mainly because most of the public are not educated in how to handle it...
Especially in the modern busy society, people are attracted to spend hours and hours in watching exciting movies, TV-series, and other entertainment stuffs rather than spending some time to continuously doing self-education in personal financial aspect. Most people think that their education was completed and done when they got out from the formal education system... and, nothing could be further than the truth!
"Catch-22" Situation:On one hand, the literature in trading field has clearly pointed out that less than 10% of the people can be profit from the market over a long period of time. On the other hand, the inflation has been consistently beating the interest rate which erode the value of cash that keep in fixed deposit or bond.
But, if one do spend time and persistently learn about how the market works, he has much better chance that he can be profit from the market rather than loosing money in it.
Take for example, it is not tougher for a child to learn to Speak Chinese, English, German or any other language if he is in that environment. Same thing as the market, it is just some specific language and rules to play the game well. If one has determine to learn it... He can be benefited... Afterall, statistics show that there are less people like to learn and think in this planet, especially something that is out of their day to day routine (or so called "Comfort Zone").. :-)
Everyone probably already has his own paradigm and idea about what's Trading...
And, What does it mean by Engineering Approach to handle the market?
It is a systematic approach, using an engineered tool to calculate the Probabilities of Best Chance in Winning of whether to Buy/Sell or Shot/Cover stocks in the market at specific time, and execute accordingly without personal emotion.
And the following is an over view of how to go about trading the market with a Big Picture in Mind.... And there are only 3 simple rules to follow:
The few Pictures above illustrate the concept and how to go about doing it....
While some gambles with calculated risk and vision can surely lead to winning towards the end, while there some gambles are sure to loose eventually... Such as ignore personal financial matters; Vote for a new president to solve financial issue, etc...
So, for those who try to completely avoid the stock market and not putting any effort to learn about it... is also a form of gambling, and they are gambling big time! Just that they might not aware of the seriousness at this moment. :-)
In actual fact, in my view, the market can be so dangerous is mainly because most of the public are not educated in how to handle it...
Especially in the modern busy society, people are attracted to spend hours and hours in watching exciting movies, TV-series, and other entertainment stuffs rather than spending some time to continuously doing self-education in personal financial aspect. Most people think that their education was completed and done when they got out from the formal education system... and, nothing could be further than the truth!
"Catch-22" Situation:On one hand, the literature in trading field has clearly pointed out that less than 10% of the people can be profit from the market over a long period of time. On the other hand, the inflation has been consistently beating the interest rate which erode the value of cash that keep in fixed deposit or bond.
But, if one do spend time and persistently learn about how the market works, he has much better chance that he can be profit from the market rather than loosing money in it.
Take for example, it is not tougher for a child to learn to Speak Chinese, English, German or any other language if he is in that environment. Same thing as the market, it is just some specific language and rules to play the game well. If one has determine to learn it... He can be benefited... Afterall, statistics show that there are less people like to learn and think in this planet, especially something that is out of their day to day routine (or so called "Comfort Zone").. :-)
Everyone probably already has his own paradigm and idea about what's Trading...
And, What does it mean by Engineering Approach to handle the market?
It is a systematic approach, using an engineered tool to calculate the Probabilities of Best Chance in Winning of whether to Buy/Sell or Shot/Cover stocks in the market at specific time, and execute accordingly without personal emotion.
And the following is an over view of how to go about trading the market with a Big Picture in Mind.... And there are only 3 simple rules to follow:
Rule 1: Buy Strong Stocks (or ETFs) in Strong Sectors when the Broad Market is Trending Upwards.
Rule 2: Short Weak Stocks (or ETFs) in Weak Sectors when the Broad Market is Trending Downwards.
Rule 3: Stay in Cash when there is no definable Broad Market or Sector Trends.
The few Pictures above illustrate the concept and how to go about doing it....

An Analogy for Trading in the Stock Market:Trading in the market is just like a General fighting a war. Imagine that you are the general, and every dollar that you have represent a soldier in your army. When you win in a battle, you capture the enemy soldiers and then you can enlist them into your army and make you stronger... Likewise, if you make a wrong decision and lost in a battle, your soldiers will be captured and your armies become weaker.
So, as illustrated in the first picture, one should be a Great Wall for defending his personal financial wealth.
As a General, you don't just send your troops to the battle fields without detail analysis of the battle field situation... You would like to attack only when the chance to win is higher. You would gather information about the strength and weakness of the enemy morale, etc... And then form a strategy and execute it. That's the first step is to know the Big Picture of the whole battle field with a map.

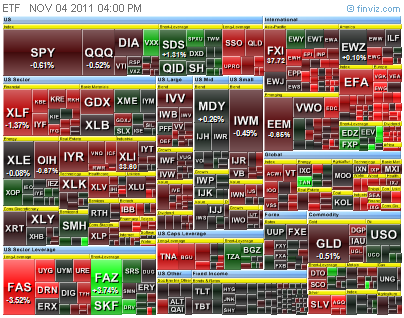
The Map of the Battle Fields (Figure 2)
There is an investment book call "If It's Raining in Brazil, Buy Starbucks", basically the concept is that if there is enough rain in Brazil, there would be plenty of coffee beans supply and Starbucks would be benefitted from it. This analogy illustrate that the global economy is more or less tie together in this globalized planet.
The Map of the Battle Fields should provide timely information for both Macro and Micro viewpoint for the enemies. This map show the Macro View of the Situation -- The Big Picture... being strong (uptrend) or weak (downtrend).
The Map of the Battle Fields should provide timely information for both Macro and Micro viewpoint for the enemies. This map show the Macro View of the Situation -- The Big Picture... being strong (uptrend) or weak (downtrend).

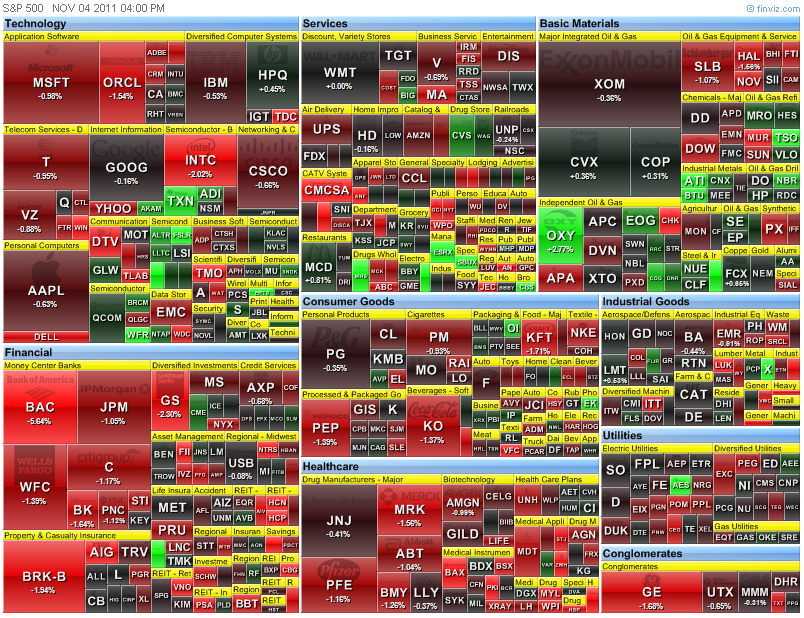
Regional Battle Fields(Figure 3 Market Sectors)After analyzing the Big Picture and see that there is a trend (strong or weak), you would like to see which sectors are the leading sector(s). In the case of market uptrend, the leading sectors are the stronger sectors, and in a market downtrend, the leading sector is the weaker sectors.

Benchmarking the individual Stock with the Market/Sector(Figure 4 Relativity)Once you identify the leading sectors... Take for example that the market is in a uptrend of average of 3% a week. You would want to select a stock that is raising more than 3% a week... That will not only ensure you to use your army in the most efficient way, but also with extra built-in safety condition.
As illustrated in Figure 4. The Upper portion of the Chart show the SPY (S&P500 ETF), and the Middle Chart show the XLE (S&P500 energy Sector). The Relativity Benchmarked Indicator is worked out by dividing the XLE daily closing price by SPY daily closing price. So, when the XLE going upwards faster than SPY, the indicator show an uptrend, and vice versa.
....... to be continue....
As illustrated in Figure 4. The Upper portion of the Chart show the SPY (S&P500 ETF), and the Middle Chart show the XLE (S&P500 energy Sector). The Relativity Benchmarked Indicator is worked out by dividing the XLE daily closing price by SPY daily closing price. So, when the XLE going upwards faster than SPY, the indicator show an uptrend, and vice versa.
There are many persons who, although knowing a great deal about the market, do not realized that the reason
why they cannot beat it,is that they
know too little about
why they cannot beat it,is that they
know too little about
themselves.
—Henry Howard Harper
....... to be continue....
3. Multiple Time Frame...
.jpg)


%20Gemini_Generated_Image_bouavabouavaboua.png)


0 Comments->:
Post a Comment