Stock Market Tools (8) - Global Trading System(GTS)


1) Is all about Data Processing and Organized it into a User Friendly Charts...


( YouTube Link <- A friend told me that the video does not appear on her browser... If so, click on the link.)

Above is an amazing video presentation by Professor Hans Rosling, a statistics guru, in many topics on global level. Such as global child mortality rate, fertility rate, etc...
For the first four minutes, it shows that most of the public are making choice/decision based on wrong pre-conceived ideas, as many of them are out dated.
After that, when the data starts moving... We can be amazed by how fast things are changing in this world! He basically transforms boring data into lively stories.


2) Is all about where the talent is applied on...

Here is a famous story by Zhuang Zi (庄子) on the power of applying the right talent in the right field...


In Song, there was a family who was skilled at making a kind of ointment (a highly viscous or semisolid substance used on the skin as medicament) which could prevent the skin from cracking.

CLICK on the diagram to Enlarge->

With this medication, this family, for generations, had been making a living by bleaching cloths in the river all year round.

On day, a traveller heard about the ointment and offered to buy the secret formula with very attractive price.
The traveller then offered the secret formula to King Wu and explained its usefulness when apply correctly in the military affairs.

King Wu took the proposal and started a naval battle during a winter against King Yue.

With the secret formula to produce and apply the ointment, the troops of Wu state were spared from catching chilblain (an inflammation followed by itchy irritation on the skins resulting from exposure to moist cold). While the Yue Soldiers suffered from skin disease and were defeated.

After the war, a portion of the conquered territory was awarded to the traveller as a fief, and he become rich main and his status was elevated.

Note: Cartoons scanned from the book "Zhuangzi Speak" by Chih-chung Ts'ai.


The moral of the story is that, though it was the same medical formula. One can use it to make a living and the other can use it to make big profit when he see the value and know where to apply it.

3) Global Trading System
This is self-explanatory...

(If the document does not appear on your browser, click on the link.)

Example

"We come this way but once. We can either tiptoe through life
and hope we get to death without being too badly bruised
or we can live a full complete life realizing
our WIDEST DREAMS."
- Bob Proctor

Self Development idea (7) - The Art of Letting Go

A great spiritual teacher had told us that:-

"Holding on to anger is like grasping
a hot coal with the intent of throwing it at
someone else; you are the one who gets burned."


So, if someone can not think that he can love his enemy... At least think in terms of "Forgive and Let Go". Let go the hot coal in the hand.

Or we can look at the matter from another perspective:
That's Dr. Daniel Amen's 18/40/60 Rule

At 18 years old - You worry about what everybody is thinking about you.
At 40 years old - You don't give a damn what anybody is thinks of you.
At 60 years old - You realize nobody was thinking about you at all.

Any Surprise? Since other people spend most of their time worry about their own "busy-ness", and not spending time thinking about you. Then what is the point of wasting any time to hate others which would be harmful to your own health?
So, the logical answer is still to "Forgive and Let Go". :-)


And, there are some simple exercises to experience the art of letting go:

Exercise 1:

Step 1. Take a piece of paper and scrunch it up to become a small paper ball.

Step 2. Use the stronger hand to grasp on the paper ball. Take a deep breath and then start to apply force to squeeze it as hard as possible... Hold the breath.... Squeeze harder... Continue to hold the breath, and continue to apply more force to squeeze harder.... continue to do so, until...

Step 3. Until that one can not take it any more. Then, release the ball, with the hand face down, and let it drop... and start to have normal breathing.

Step 4. Feel the sensation of "letting go" in your hand. Doesn't it feel good?


Exercise 2: Sedona Method.

Step 1. The first step is to identify the feeling that one wants to let go.

Step 2. Then ask oneself the following three questions:

Q1. Could I let it go?
Q2. Would I let it go?
Q3. When?

Yes. These steps and questions look very simple. And if one seriously asking the questions and think carefully. One will find that the choice lay within himself. The answers would then be: Yes, Yes, and Now.


As scientists have estimated that the average human has 60,000 thoughts a day. This may be sound interesting as human mind do not stop imagining/thinking all day long.
And, something more interesting is that, according to Dr. Deepak Chopra, 90% of the thoughts you have today are the one you had yesterday!

Therefore, it is a very Important task for every individual to make sure that his dominant thoughts are of good intention and a happy one, or else, like it or not, it will has HIGH chances to come back tomorrow.


"Every event that baffles you today had its seed
in an intention yesterday."
- Deepak Chopra


"Never let yesterday use up too much of today."
Will Rogers: Humorist


"Let go of the past and the past will let go of you."
- unknown

----------------------------------------------------------------------------------------------------------------
Added on 14 Dec 2012 - A relevant Picture found in facebook:


Happiness is a state-of-mind. 
It is a personal choice.
It is an in-side job! 


<Go to HOME>

Games that People Play(1):- 挟天子以令诸侯

When most people hear that the world is actually controlled by a very few minority people/families who controlled most of the governments in the world... They would simply say that "IT IS IMPOSSIBLE!"

But, in reality, this is not a new concept at all. It happened around the world everywhere. Take for examples:-


In the late Han Dynasty, around 1800 years ago, in China, there was a minister - Cao Cao.
Cao Cao hold the weak Emperor under his control, and made use of the formal legal authority of the Emperor to control the other warlords and force them to comply to his order. In Chinese, it is well known as "挟天子以令诸侯 ". This strategy been repeatedly used in the history. Including the WWII that Japanese used it on China.
Fortunately, there is a defect in this strategy... That is people can see it clearly and try to repel it.
Therefore, in order to use this strategy in modern day, it must be modified, and lets look at how people play this game in this day and age. It must make sure that the people have the good feeling that seem like they have the choice. Like the illustrations from the video and picture below:-

Choosing between two men, or puppets, with the same secret boss behind is still choosing the secret boss.
. .


If the Video above does not appear on your browser...
Then, click on this Youtube Link.

Something Not in the Text Book...

“You may fool all the people some of the time, you can even

fool some of the people all of the time, but you

cannot fool all of the people all the time.”


- Abraham Lincoln


----------------------Added on 13 Apr 2025-----------


Trap for Investors (4) - Ponzi Scheme and it's Derivatives

Below is a good video clip that explains what is a Ponzi Scheme.


* Why some insurance company policies will eventually ended up like a Ponzi Scheme.


There were many insurance policies that promise certain amount of annual return at the policy mature date, usually a few tens of year from the beginning of the policy. In order to attract the customers, the return has to be attractive enough. Also to minus of all those big bonus for the executives and commission of the salesman, plus the tough economy time to make profits from the market. One of the KEY SOURCE of income would be the new comers to the pool.


To see how this kind of system would fail, one would need to examine the Population Pyramid attached below. (Click to Enlarge)


Population Pyramid (Click on the Chart to Enlarge)


Take for example, many well developed countries are now in the Stage 3 of the pyramid (Stationary) and in the progress of moving towards Stage 4 (Contracting). And, some countries are trying to solve the problem by importing younger workers through immigration policy. But, this could ended up worse when the world economy is not growing.


Therefore, there are many Ponzi Scheme Derivatives such as certain type of Life Insurance Policies, which include the US Social Security System.


The following are good video clips that explain the problem with the Population Pyramids in most developed countries.


* Why inflation is a MUST, in order to keep the current system running.


Around the world, there are many countries, including China, at this point are suffering pain for the Pension Scheme for the retired workforce. In general, a pension is an arrangement that provide the people with an income when they retire from their job till the day he/she leave this planet. Of course, we don't get to see this kind of offer nowadays, but it was popular, especially for civil servant, just about 40-50 years back ...


During that time, the medical is not so advanced and average life expectancy was around 65-70. While just after the WWII for not long, everywhere is booming, the economy grow rate was just taking off. And, currently, the average life expectancy has been increase to about 80 and still seems to moving up. Attached is a typical chart on life expectancy chart found from the web...


On the other hand, the growth of the economy in most developed countries are saturated. As also shown in the population pyramid chart, while more and more people are retiring, there is less and less new work force competing more and more aggressively in the competitive global market.


While the politicians want to be elected or re-elected, they must keep the promise on the Pension Scheme. Naturally, they would keep their promise to pay the retirees, but they would pay more to the workers who are still working on the jobs. While the economy is not growing, the only way is to Increase the Money Supply or so call Print More Money... When more money is flowing into the society while the productivity remain the same... It basically dilute the previous-earned money that keep in the bank.


So, eventually, those people depend on pension system on their retirement will find that their buying power are reducing year by year with respect to the inflation.


After all, keeping cash in the bank has many risk nowadays....
Such as bank go bankrupt or value of money get diluted for sure.
Therefore, learning how to grow the money is a wise thing to do.


If you don't see the document attached below, click on the link:->


"Wealth is the product of man's ability to think."
-Ayn Rand


Relevant Article:- On Population Pyramid


<<<<<<<<<<<<<<<<<<  NOTE ADDED ON 10 OCT 2012  >>>>>>>>>>>>>>>>>>>>>

The above article was posted immediately after I heard of GENNEVA GOLD investment scheme that can give 24% annual return on Capital.  

Now, it has became history.


Is this a Conspiracy Theory or Fact? Lindsey Williams DVD - The Elite Speak

For sure, many people would not like to spend time to know about something that is called conspiracy. And yet, in the past, many conspiracies had became Facts.

Anyhow, Lindsey Williams did predict many big events that had happened, especially on the Crude Oil price movement.

I don't think everything that he said is correct as there are conflicting messages. But there is no harm in knowing some alternative views of how the world events will happen in his view point. Or just treat it like watching another fiction movie, like 2012 or Avatar. Just need to have an open mind... and think for yourself, as he say that he is just a messenger. Also to ignore any religion's prophecy that get to mix into the video... especially on the 2nd half of the 3rd DVD.

Anyway, his predictions are talking about things going happen in the next 12 months or so. So, we would know if this is a BS or fact in next year.


To continue to watch the whole series in order... Click Here -> Link to youtube.

Here are some of the key points:-

* Human already mastered the technology to influence/control the weather... Such as direct the route of a tornado or hurricane. Google for "HAARP" if you are interested.

* Oil is priced in USD, and USD is going to devalue from 30 to 50 % in 2010.
(If this come true, oil price must raise by equal amount, inflation would be serious).

* Financial Deficit Spending is a wash in paper.
(If this come true, investment instrument that promise in paper is going to be washed away... Such as T-Bill, any derivatives,etc.)

The rest is for those who interested to find out the story....


"Money is a symbol of our confidence in our product,
our service and ourselves! The more confidence
we have in ourselves and/or our product
or service, the more we will be able
to charge for it."
- Paul McKenna

Trap for Investors (3) - Too Big To Fail: Foreign Exchange (Forex) Market


Data from: http://www.mrainvestmentsllc.com/home/


Well, this is a known fact. Isn't it?
After the Nasdaq bubble, then by the Housing Bubble, followed by the Subprime Mortgage Crisis... What all US had done, and still doing it now, is to continue printing more money, and they call it stimulus and bailout.

So, we need not to be an economist to deduce that US Dollar is getting weaker and would continue so unless there is a change in the course of action.

Meanwhile, the people who hold on to cash in term of US Dollar would naturally doing their best to protect the value of their money by converting it into other "safer currency". Adding those traders and speculators encouraged by the financial houses... It is leading to another BIG BUBBLE, and it is already FORMED! That's hidden inside the Forex Market.

So, how Big is this Forex Market actually? Any idea?
Well...
Let's look that the short clip from his documentary,"Debt as Money II", Paul Grignon had a summary on that: " The transactions taken place in the Foreign Exchange Market in one week EXCEED the total value of the World Trade for Real Good & Services in the entire year."

(start from 3:11 -> 3:50)


While Forex is a HIGH LEVERAGE vehicle, some brokerage houses margin offer up to "400-to-1" or "100 to 1"!

When the public been seeing the trend of US Dollar continue for years to become weaken, they would want move their US Dollar to something else. EURO seems to be an Excellent choice, as it be trending up and up for years.

Did you ever ask that IF the Public is Right that the US Dollar is continuing to get weaker week by week, and month by month for another sure period of time, let say one year or two as suggested by some Gurus who sold newsletters...
Where are they got to claim their profit from???

So, when it come to a time that the statistics indicate most of the public money had already been sucked into Forex Market and BET on the EURO Win Over US Dollar... Something MUST HAPPEN...

So, now we have Greece Financial Crisis surface up....
Possibly follow by Portugal, and even possibly follow by Spain...

This would Create a FEAR for people to hold onto the EURO.
It will come to a point, like a crowd in a building that suddenly caught big fire everywhere, all people want to rush for the small exit all at one time, many would be burned.  And, it could collapse the EURO in a very short period of time.

Is this yet another unpredicted event?
Actually, we are all co-creating the event.
We can choose to follow or not to follow.


"When masses of people succumb to an idea, they often
run off at a tangent because of their emotion."
- Humphrey B. Neill
(The art of Contrary Thinking)

Chinese New Year Greeting

Click to enlarge


Oh! Did you drop by here by accident?
No way. There is synchronicity in everything that we do.

You are dropping by so that these angels of prosperity (招财童子) can get to know you... and they are on the way, rushing to send you tons of GOLD NOW! :-)


May the rest of your life be the best of your life.
- Jose Silva

Bless You
KH Tang

Stock Market Tools (7) - Back Testing

Here is a famous quote from the Art of War by Sun Tzu, and it said that "If you know your enemies and know yourself, you will not be imperiled in a hundred battle".-知彼知己,百戰不殆.

One of the most useful Stock Trading Tool is Back Testing, as a test result worth more than a thousand opinions. It provides the user to test out the feasibility of his idea or strategy with historical data before putting down his hard-earned money to try out. Or to sum it up, Back Testing can provide the opportunity for one to understand the market behavior(enemy) and evaluate his own strategy(know yourself) ,in simulation mode, first before he handle the real battle.

Lot of the time, the test data will shock the tester. For example, in the previous article on the Jesse Livermore Market Key System. Although Jesse Livermore used it to track and trade the daily market, it is interesting to found that the Monthly Back Testing Result has better yield than Weekly, and the Weekly Back Testing Result has better yield than daily. (Tested with SPY)

Unfortunately, MOST of the trading software, especially those trading classes with online subscription DO NOT provide any Back Testing tool. The reason is simple. If they were to provide such tool, it would just demonstrate on the spot that their trading system would not work over a long period of time with historical data. :-)

The following are couple of Back Testing Charts from the book, "The Encyclopedia of Technical Market Indicators", by Robert W. Colby. This book is around 800 pages, and with hundred of Back Testing Charts for different indicators.


Now, let's review the next few charts:-

1) MACD Back Testing Result.
MACD is probably the most popular technical indicator that use by the public for analyzing the stock momentum and trend. Almost all of the Online or Offline Trading Software Package offer such tool. BUT, apparently, it has lost its effectiveness after 1980. This was the period of time when personal computer started to get popular.


MACD Back Testing Result (Click on the chart to enlarge)

2) Multiple Time Frame(MTF) Back Testing Result.
In short, the idea of multiple-time-frame is for a trader to trade on a particular time frame with momentum while riding the longer time frame trend. For example, a day trader that focus on few minutes momentum must also take note of the trend of the daily chart. Swing Trader who hold positions for the momentum for a couple of days must also be in sync with the trend of the weekly chart.


Interesting enough, this strategy also lost it effectiveness when more public get to know it. :-)
A suggestion is to use some Optimization Tool (to be discuss in the next article soon) to use parameters that are different from the public setting, which usually are the default setting of software package.


MTF Back Testing Result (Click on the chart to enlarge)


3) Volume-Based Indicator Back Testing Result.
There are only 5 parameters in the stock data to perform the analysis. That are Open, High, Low, Close and Volume. And, many books have painted the picture that Volume-Based indicator has the ability to act as a Leading Indicator. Which this WAS Truth in the non-computerized age, but no more holding true at this time. The following chart will speak for itself.


There are a few popular Volume Based Indicators: Namely, On-Balance Volume (OBV), Money Flow, and Accumulation/distribution index, etc. Basically, it considers if today Close (Closing Price of the stock) is higher than yesterday Close, it is a accumulation (demand stronger than supply that push up the price.)


The easiest way for the manipulators to Trick the public with such thinking is that they would sell a whole lot of particular shares on the day from the beginning to the last few minutes... Then they just need to buy back some just before the closing bell ring to make sure that the price is closed higher than yesterday Close. This is particularly true for stocks that are traded with low volume... Say below 100k/day.


Then for those who using such volume-based indicator will think that was an accumulation activities from big buyer. Nothing can be further from the truth.


Actually this idea of volume base indicator has a long history background... It is a short form of the famous "Tape Reading" which make some people to become Guru by mastering such skill. Such as, Jesse Livermore, Richard Wyckoff, Humphrey B. Neill, etc...


But, they are actually compiling the data from every transaction from the tape. While the daily data ONLY OFFER the 5 parameters, Open, High, Low, Close and Volume. The formula in the computer has to make an assumption that strength of Demand and Supply of all transactions over every second, minute or hour during the day are the same... That's why Real Time Data need to be paid, and Daily Data are for FREE. While the actual Tape Reading can still be done today by computer, but it is too much of a task for individual trader. --> TAPE READING.


The following chart shows that purely making decision on volume-based indicator is no more going to make any profit in the market today.


Accumulation/Distribution(A/D) Back Testing Result
(Click on the chart to enlarge)
Ironically, the above-mentioned technical tools are among the most popular tools that a novice would receive if he goes for a trading class. Which could cost them thousands of dollars... And then come with an annual subscription to use their tools which needs to be renew continuously. (Me Too. Been There, Done That.)


4) Market Breadth Indicators Back Testing Result
In his book, "The Complete Guide to Market Breadth Indicator: How to Analyze and Evaluate market Direction and Strength", Greory Morris has compiled a big list of Market Breadth Indicator that the readers can program for themselves to analysis the market.


Basically, the individual stock in the market tends to move like a school of fish... They move in the same direction and also turn the direction almost together, and at the same time.


Or it can put in another way... individual stock can be manipulated much more easily than a number of stocks bundle together.


The following two charts illustrate the Back Testing Result of Market Breadth Indicators.


Advance/Decline Momentum Oscillator


McClellan Oscillator


For today market, Market Breadth Indicators are actually getting more and more useful for trader or investor. As there are more and more index Tracking ETFs and Sector ETFs.

On the right hand side of the of the column, under the Financial Tool Section, there is a link "Market Breadth Charting for ETFs" that provide free market breadth indicator for major ETFs.


Last but not least...


"Plan for the future, because that is where you are going to spend the rest of your life."
-Mark Twain


Has Global Warming happened before?

--------------------------------------------------------8<-------------------------------------------------------
Global Warming has happened before. Higher temperatures on earth are not unknown. The most extreme was the earth's climate in the Upper Cretaceous Period (86 million years ago), which was far warmer than today. The Mean Surface Temperature across the Earth during this time has been estimated as being 11°c warmer than now.
--------------------------------------------------------8<------------------------------------------------------

So, the next question would be...
How did that happen? What was the main cause?
Obviously, it could not be caused by the cavemen that burning too much wood during their time... nor too much waste generated by the dinorsaurs...

See. The reason for asking these questions is that all public media is now *educating people that the Main cause for global warming is because that Human being release too much CO2. --> And, the solution is to impose a Carbon Tax.

Below is a clips on the video titled "Global Warming or Global Governance" DVD.
In the DVD, dozens of leading climate scientists, experts and politicians show that this is not true. It states that the main cause of Global warming is a natural phenomenon, which is the activities on the Sun. While the *propaganda or *advertising to sell the idea that it is man-caused is aimed to get the public to support the Carbon Tax (global tax).

So, could this idea of "Global Warming caused by man that need Global Carbon Tax" works similar like "Iraq had Mass Destruction Weapons that needed US Army to Save the World"???

That why Ralph Waldo Emerson said:"What is the hardest task in the world? To Think."


Thanks to someone, who had uploaded the complete video in YouTube...
If you are interested, just google it and it can make you to think harder with more non-publicized information.


(.......................................Click on the right edge of the slide to flip the slide.)


by the way...
* The term "Propaganda", "Advertising" or "Educating" are actually used interchangeably nowadays. It is up to the individual to spot them and be alert with that.


** Do you aware that there are now more than 30,000 scientists sue Al Gore for Global Fraud, and produce lot of counter-evidences that Al Gore put in his global warming show "An Inconvenient Truth". Here is a good SOURCE that compile such information. <-Click here if you want to know more. :-)


“The first man who, having fenced in a piece of land,
said, ‘This is mine,’ and found people naïve
enough to believe him, that man was
the true founder of civil society.”
— Jean-Jacques Rousseau
Bless You
KH Tang

Stock Market Tools (6) - Livermore Market Key

"MANY years of my life had been devoted to speculation
before it dawned upon me that nothing new was happening in the
stock market, that price movements were simply being repeated, that while
there was variation in different stocks the general price pattern was the same...."
- Jesse Livermore


Livermore Market Key Table. (Click to enlarge)


In his book, "How To Trade In Stock"(<-downloadable), the stock speculation king, Jesse Livermore had spent a great deal of effort to illustrate how he used his own method in determining the trend of stocks... And he named it as the "Livermore Market Key".

Although the method was published in 1940, and many traders who had read some classical trading book must have come across this Tool, this method is not popular at all. I guess, most likely, that it involves with lot of manual work in updating the table as shown above. With current technology, this can be programmed into charting format to make it more user friendly as the following chats...


In the Market Key System, Livermore applies two level of filter to double check whether the stock is in Up-Trend or Down-Trend. So at anytime, a stock is classified into one of the six states:-
1: Up Trend, - (Long - Plotted as Green in the following Diagrams)
2: Natural Rally, - (Close position and stay with Cash)
3: Secondary Rally, - (Close position and stay with Cash)


4: Down Trend, - (Short - Plotted as Red in the following Diagrams)
5: Natural Reaction, - (Close position and stay with Cash)
6: Secondary Reaction. - (Close position and stay with Cash)


In his example, Jesse Livermore use 5 points as the filter threshold for stock that go from 30 plus to 100. To make it able to use of all price range of stock, using "percentage change" would be a good choice for programming the algorithm. And, in fact, this is the ONLY parameter that needs to be taken care of...


Parameters Setting:

All the following charts are using the same setting of 10% as filtering threshold. Of course, one can go through computerized optimization to find out what value work best, over here it is just for illustration purpose.


The next three charts below are S&P500 Monthly, Weekly and Daily Chart. And are all have the Livermore Market Key with 10% threshold setting:-

SPY (S&P500) Monthly Chart: Click to enlarge


SPY (S&P500) Weekly Chart: Click the Chart to enlarge


SPY (S&P500) Daily Chart: Click the Chart to enlarge

It shows that there are more Buy and Short Signals from shorter time-frame chart, that's the daily chart. (But, the back test data show that the Monthly Chart actually gain more profits.)
The following are just some charts around the globe with this indicator:-


China SSE Composite Daily Chart: Click to enlarge:

Singapore Straits Time Index Daily Chart: Click to enlarge

UK ETF Daily Chart: Click to enlarge

Germany ETF Daily Chart: Click the Chart to enlarge

Note: The back tested data has shown a surprising fact: That's this algorithm work better in longer time frame... That is trading with weekly charts are more profitable than daily charts.

The Algorithm that describes in his book, "How to Trade in Stock" is now decoded in the form of programming flow-charts, and it can be download here.:->
Programming the Jesse Livermore Market Key

Jesse Livermore once said: "It was never my thinking that made me money but my sitting tight."
How True! People would normally think too much either win or lose in their account with the emotion of greed or fear. Only those who work with system and stick with it can sit tight.

"...providing tools that can be utilized to evaluate information is more important than providing information; that tools whereby one can use his/her judgment is more important than providing values, and demanding responsibility is more important than providing laws and rules of conduct. The latter should be the default of only those who are unable or unwilling to take responsibility." - Clara Szalai (Philosopher, Writer)


The program source code in AFL can be download from:
2) Amibroker's AFL Library.(Need some little work to re-define the plotting state.)

----------------------------    Additinal note added on 10 May 2012  -------------------------------------
Like most other single stock indicator, Livermore Market Key was designed to analysis single stock.  In his book, Livermore put recommend to put two similar stocks(same sector) next to each other as to it would help to confirm the signals. 
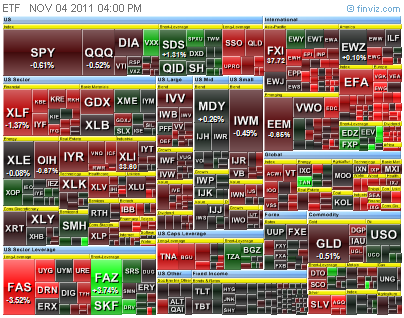
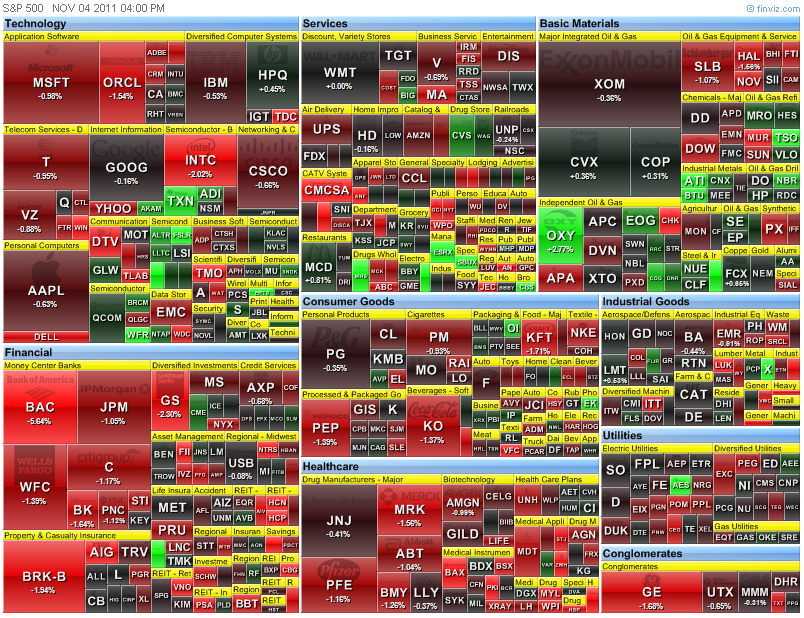
As of today, the market is much more complex.  It is recommend to have a overall view on the market with the concept of -> Sector Rotation <- rather than just focus in one stock.


---------------------------- Additional note added on 19 Apr 2013  -------------------------------------

Just thought of an idea.

Instead of plotting the levels indicator, one can actually plot these level lines ONTO the price chart itself.  The advantage would be knowing in advance the exact stop level instead of waiting for the indicator to switch states.

Would get back to work on this soon.

---------------------------- Additional note added on 06 May 2013 -------------------------------------

As promised on the last update, the following linked shows the Livermore Secret Market Key's Levels plotted on the price chart itself.  Very much helpful in visualizing the market action taking place and how the Market Key works!

Livermore Secret Market Key on Price Chart


---------------------------- Additional note added on 29 Sep 2013 -------------------------------------

When the Livermore Market Key fires the signals, it is the time when the Dow Theory three movements are in the same direction... 

http://blessedfool.blogspot.sg/2013/09/project-freedom-13-multiple-time-frame.html


------------------  Additional Information  Added on 06 Jan 2015 -----------------------

Excerpt from the book - Jesse Livermore's Methods of Trading in Stocks - written by Richard D. Wyckoff
//--------------------------------------------------------------------------------------------------//
HIS OFFICE EQUIPMENT

He arrives at his office ,which is on one of the upper floors of a big down town skyscraper. There is no name on the door. It consists of a reception room,private offices for some of his assistants. and his own private office,separated by swinging doors from his board.room. This is an oblong room with a long silicate quotation board on one side and a row of windows opposite. On the board are exhibited quotations for thirty or forty of the leading active stocks, and a few each of the active futures in cotton, wheat, corn and oats. The quotation board is not arranged according to the ordinary custom prevailing in brokerage houses. The changes in quotations are not posted by means of printed tickets containing merely the opening, high, low and last figures; instead , each stock has its own column running the full length of the board. in which the various changes in quotations are written with chalk, with the numerous sales strung along down below the abbreviations. He prefers this kind of board because it gives him a line on the swings of a stock, the extent of its rallies and reactions, as well as its relative activity. The volume of trading does not appear on the board; he gets this from the tape.

(Also in the the book - there is a concise chapter on Tape Reading)
Chapter 4. How Livermore Reads The Tape
                 How He Judges The Turning Points
                 How He Plays The Intermediate Swings

//---------------------------------------------------------------------------------------------------//
For those who are interested in Livermore methodology, you probably had read the book -   Reminiscences of a stock operator written by Edwin Lefevre. (PDF version is easily available by online search.)
Just the first few pages, it disclosed the method that brought him into the stock market as a child.  What is it???  --> TAPE READING!

In Short, the Jesse Livermore Secret Market Key is NOT COMPLETE without integration of the trading volume from Tape Reading.


Enjoy. :-)


Bless You
KH Tang


HOME