Here is a famous quote from the Art of War by Sun Tzu, and it said that "If you know your enemies and know yourself, you will not be imperiled in a hundred battle".-知彼知己,百戰不殆.
One of the most useful Stock Trading Tool is Back Testing, as a test result worth more than a thousand opinions. It provides the user to test out the feasibility of his idea or strategy with historical data before putting down his hard-earned money to try out. Or to sum it up, Back Testing can provide the opportunity for one to understand the market behavior(enemy) and evaluate his own strategy(know yourself) ,in simulation mode, first before he handle the real battle.

2) Multiple Time Frame(MTF) Back Testing Result.
In short, the idea of multiple-time-frame is for a trader to trade on a particular time frame with momentum while riding the longer time frame trend. For example, a day trader that focus on few minutes momentum must also take note of the trend of the daily chart. Swing Trader who hold positions for the momentum for a couple of days must also be in sync with the trend of the weekly chart.
Interesting enough, this strategy also lost it effectiveness when more public get to know it. :-)
A suggestion is to use some Optimization Tool (to be discuss in the next article soon) to use parameters that are different from the public setting, which usually are the default setting of software package.

3) Volume-Based Indicator Back Testing Result.
There are only 5 parameters in the stock data to perform the analysis. That are Open, High, Low, Close and Volume. And, many books have painted the picture that Volume-Based indicator has the ability to act as a Leading Indicator. Which this WAS Truth in the non-computerized age, but no more holding true at this time. The following chart will speak for itself.
There are a few popular Volume Based Indicators: Namely, On-Balance Volume (OBV), Money Flow, and Accumulation/distribution index, etc. Basically, it considers if today Close (Closing Price of the stock) is higher than yesterday Close, it is a accumulation (demand stronger than supply that push up the price.)
The easiest way for the manipulators to Trick the public with such thinking is that they would sell a whole lot of particular shares on the day from the beginning to the last few minutes... Then they just need to buy back some just before the closing bell ring to make sure that the price is closed higher than yesterday Close. This is particularly true for stocks that are traded with low volume... Say below 100k/day.
Then for those who using such volume-based indicator will think that was an accumulation activities from big buyer. Nothing can be further from the truth.
Actually this idea of volume base indicator has a long history background... It is a short form of the famous "Tape Reading" which make some people to become Guru by mastering such skill. Such as, Jesse Livermore, Richard Wyckoff, Humphrey B. Neill, etc...
But, they are actually compiling the data from every transaction from the tape. While the daily data ONLY OFFER the 5 parameters, Open, High, Low, Close and Volume. The formula in the computer has to make an assumption that strength of Demand and Supply of all transactions over every second, minute or hour during the day are the same... That's why Real Time Data need to be paid, and Daily Data are for FREE. While the actual Tape Reading can still be done today by computer, but it is too much of a task for individual trader. --> TAPE READING.
The following chart shows that purely making decision on volume-based indicator is no more going to make any profit in the market today.
 Ironically, the above-mentioned technical tools are among the most popular tools that a novice would receive if he goes for a trading class. Which could cost them thousands of dollars... And then come with an annual subscription to use their tools which needs to be renew continuously. (Me Too. Been There, Done That.)
4) Market Breadth Indicators Back Testing Result
In his book, "The Complete Guide to Market Breadth Indicator: How to Analyze and Evaluate market Direction and Strength", Greory Morris has compiled a big list of Market Breadth Indicator that the readers can program for themselves to analysis the market.
Basically, the individual stock in the market tends to move like a school of fish... They move in the same direction and also turn the direction almost together, and at the same time.
Or it can put in another way... individual stock can be manipulated much more easily than a number of stocks bundle together.

The following two charts illustrate the Back Testing Result of Market Breadth Indicators.


Lot of the time, the test data will shock the tester. For example, in the previous article on the Jesse Livermore Market Key System. Although Jesse Livermore used it to track and trade the daily market, it is interesting to found that the Monthly Back Testing Result has better yield than Weekly, and the Weekly Back Testing Result has better yield than daily. (Tested with SPY)
Unfortunately, MOST of the trading software, especially those trading classes with online subscription DO NOT provide any Back Testing tool. The reason is simple. If they were to provide such tool, it would just demonstrate on the spot that their trading system would not work over a long period of time with historical data. :-)
The following are couple of Back Testing Charts from the book, "The Encyclopedia of Technical Market Indicators", by Robert W. Colby. This book is around 800 pages, and with hundred of Back Testing Charts for different indicators.
Now, let's review the next few charts:-
1) MACD Back Testing Result.
MACD is probably the most popular technical indicator that use by the public for analyzing the stock momentum and trend. Almost all of the Online or Offline Trading Software Package offer such tool. BUT, apparently, it has lost its effectiveness after 1980. This was the period of time when personal computer started to get popular.
MACD Back Testing Result (Click on the chart to enlarge)

2) Multiple Time Frame(MTF) Back Testing Result.
In short, the idea of multiple-time-frame is for a trader to trade on a particular time frame with momentum while riding the longer time frame trend. For example, a day trader that focus on few minutes momentum must also take note of the trend of the daily chart. Swing Trader who hold positions for the momentum for a couple of days must also be in sync with the trend of the weekly chart.
Interesting enough, this strategy also lost it effectiveness when more public get to know it. :-)
A suggestion is to use some Optimization Tool (to be discuss in the next article soon) to use parameters that are different from the public setting, which usually are the default setting of software package.
MTF Back Testing Result (Click on the chart to enlarge)

3) Volume-Based Indicator Back Testing Result.
There are only 5 parameters in the stock data to perform the analysis. That are Open, High, Low, Close and Volume. And, many books have painted the picture that Volume-Based indicator has the ability to act as a Leading Indicator. Which this WAS Truth in the non-computerized age, but no more holding true at this time. The following chart will speak for itself.
There are a few popular Volume Based Indicators: Namely, On-Balance Volume (OBV), Money Flow, and Accumulation/distribution index, etc. Basically, it considers if today Close (Closing Price of the stock) is higher than yesterday Close, it is a accumulation (demand stronger than supply that push up the price.)
The easiest way for the manipulators to Trick the public with such thinking is that they would sell a whole lot of particular shares on the day from the beginning to the last few minutes... Then they just need to buy back some just before the closing bell ring to make sure that the price is closed higher than yesterday Close. This is particularly true for stocks that are traded with low volume... Say below 100k/day.
Then for those who using such volume-based indicator will think that was an accumulation activities from big buyer. Nothing can be further from the truth.
Actually this idea of volume base indicator has a long history background... It is a short form of the famous "Tape Reading" which make some people to become Guru by mastering such skill. Such as, Jesse Livermore, Richard Wyckoff, Humphrey B. Neill, etc...
But, they are actually compiling the data from every transaction from the tape. While the daily data ONLY OFFER the 5 parameters, Open, High, Low, Close and Volume. The formula in the computer has to make an assumption that strength of Demand and Supply of all transactions over every second, minute or hour during the day are the same... That's why Real Time Data need to be paid, and Daily Data are for FREE. While the actual Tape Reading can still be done today by computer, but it is too much of a task for individual trader. --> TAPE READING.
The following chart shows that purely making decision on volume-based indicator is no more going to make any profit in the market today.
Accumulation/Distribution(A/D) Back Testing Result
(Click on the chart to enlarge)
 Ironically, the above-mentioned technical tools are among the most popular tools that a novice would receive if he goes for a trading class. Which could cost them thousands of dollars... And then come with an annual subscription to use their tools which needs to be renew continuously. (Me Too. Been There, Done That.)
4) Market Breadth Indicators Back Testing Result
In his book, "The Complete Guide to Market Breadth Indicator: How to Analyze and Evaluate market Direction and Strength", Greory Morris has compiled a big list of Market Breadth Indicator that the readers can program for themselves to analysis the market.
Basically, the individual stock in the market tends to move like a school of fish... They move in the same direction and also turn the direction almost together, and at the same time.
Or it can put in another way... individual stock can be manipulated much more easily than a number of stocks bundle together.

The following two charts illustrate the Back Testing Result of Market Breadth Indicators.
Advance/Decline Momentum Oscillator

McClellan Oscillator

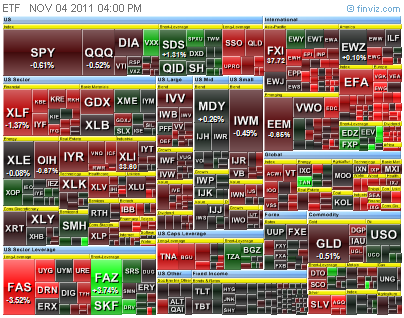
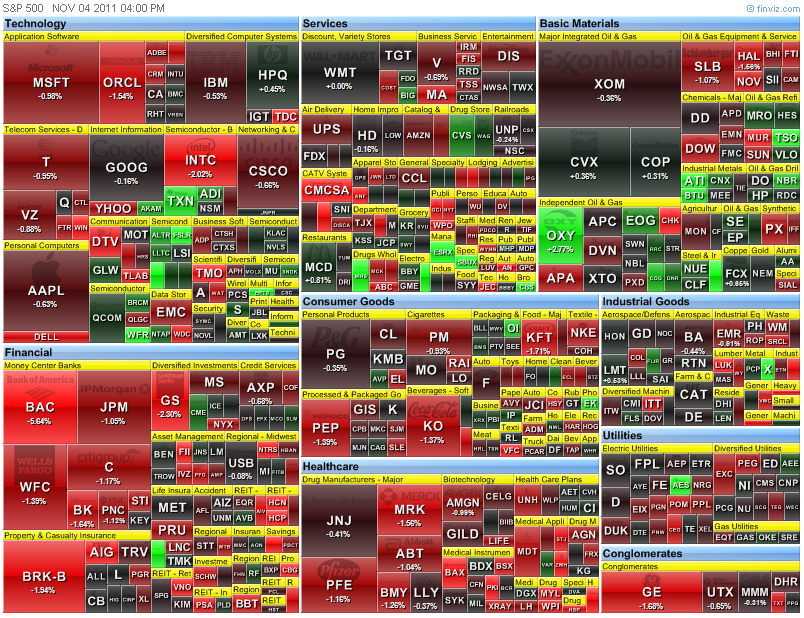
For today market, Market Breadth Indicators are actually getting more and more useful for trader or investor. As there are more and more index Tracking ETFs and Sector ETFs.
On the right hand side of the of the column, under the Financial Tool Section, there is a link "Market Breadth Charting for ETFs" that provide free market breadth indicator for major ETFs.
Last but not least...
Here is a short Video to demonstrate a Typical Back Testing Process. <- Click
"Plan for the future, because that is where you are going to spend the rest of your life."
-Mark Twain
.jpg)


%20Gemini_Generated_Image_bouavabouavaboua.png)


11 Comments->:
There is this great new product called the Trading Blox Equity System Pack. I’ve heard about it from friends and associates. This new software helps you manage and save money by showing you what decisions make sense and what doesn't. I’ve checked out this product at http://www.tradingblox.com/?page_id=1136 , you should too. It is the next big thing to hit the financial sector.
new updated software for your windows
software downloads freeware and many more Softwares are download from here.
Keep your system update software latest and more programs.
Amazing Stock Exchange any guide for help???
Cracked Softwares | Full Software Download
The great post about Stock Exchange, it's a very helpful tip, thanks a lot for sharing.
PC Games Free Download
Thanks for sharing..!! I love your post .. I am looking more post like this one on this blog .. this post proves really helpful for me .Full SoftwareDownload
What is the new update about it.?
cracked software download | makemkv serial
oh wow!! this is really nice, such a nice piece of work..............
crack software download
this is a valuable and helpful sharing.thanks for this posting..
room arranger portable
Kh Tang'S Blog: Stock Market Tools (7) - Back Testing >>>>> Download Now
>>>>> Download Full
Kh Tang'S Blog: Stock Market Tools (7) - Back Testing >>>>> Download LINK
>>>>> Download Now
Kh Tang'S Blog: Stock Market Tools (7) - Back Testing >>>>> Download Full
>>>>> Download LINK
Post a Comment