Every culture has its redemption stories, but few hit as hard as the tale of Zhou Chu. It's about hunting monsters—only to find the last one is you. And it isn't really an old story. It's happening again, right now, to all of us.
During the Jin Dynasty, the town of Yixing was tormented by what locals called the "Three Harms." Two were beasts: a tiger prowling the mountains and a flood dragon in the river. The third was a man—Zhou Chu himself, strong beyond reckoning, quick to violence, feared by everyone.
Too afraid to confront him, the villagers tried something clever. They praised his strength and begged him to slay the tiger and the dragon—secretly hoping all three terrors would destroy each other.
Zhou Chu agreed at once. He killed the tiger, then plunged into the river after the dragon, fighting three days and three nights until the water went still. He dragged himself home expecting a hero's welcome—and found the streets celebrating, because the people believed he had died.
In that instant, the truth landed: of the three harms, he had always been the worst.
He could have answered with rage. Instead, humbled, he sought out scholars, remade his life, and became a man of justice—slaying the third and final harm, his old self.
Now look at our own time. The shape repeats. Three harms are terrorizing ordinary people again.
The first is a beast loose in the mountains: artificial intelligence. As it sharpens by the month, it swallows whole categories of work—jobs people trained years for, gone almost overnight.
The second is a dragon beneath the water: quantitative trading. Markets that once rewarded patience and common sense are now ruled by machines that calculate faster than any human can. For the ordinary investor, the river has turned against them.
The third is hardest to see, because—just as in Yixing—it lives inside us: the old map in our heads, a picture of the world that no longer matches the territory. We work harder, push longer, follow the routes our parents trusted. And still we get nowhere, because those roads no longer exist.
Like the villagers, we want to blame the beasts outside. But the legend already told us where the real battle is.
The modern Zhou Chu doesn't begin by fighting AI or the markets. He begins with himself—tearing up the old map and drawing a new one fit for this age.
He stops fearing AI and learns to walk beside it. He turns the first harm into an ally, and lets it help him build what the old world never offered an ordinary person: his own quantitative trading system—his answer to the second harm.
And in doing so, he slays the third harm: the outdated self. Exactly as Zhou Chu did seventeen centuries ago.
The monsters were never only outside. Neither was the victory.
Now, some of you are thinking this isn't realistic. So let me show you.
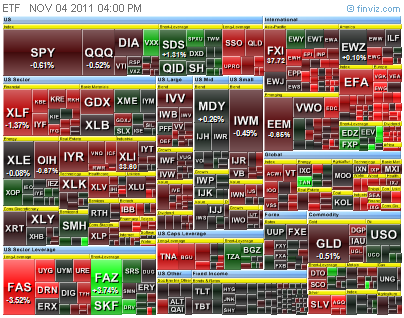
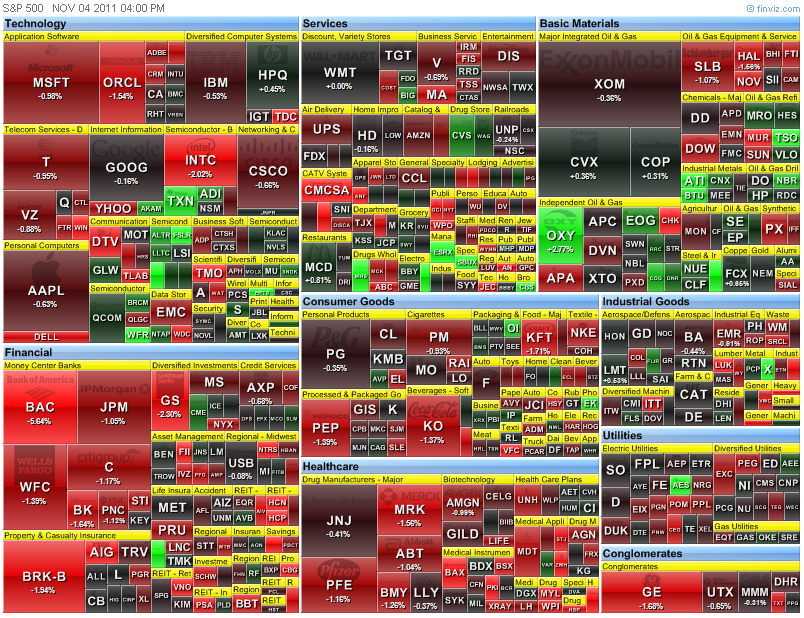
I asked an AI to write a quant trading system for my AmiBroker platform. Within minutes, it produced several—complete with backtesters and exploration programs. I ran the backtest, and here are the results:


This is a monthly rebalanced system built on Cross-Sectional Momentum Z-Score. A trend-following approach that you only touch once a month—monitor at the start of each month, take whatever action is needed, and walk away.
A word of honesty, though. I've marked the results in red, because most people couldn't stomach a drawdown that deep or a Sharpe ratio that low in a live trading system. And there's a second caveat worth stating plainly: the tested database doesn't include delisted stocks, which means survivorship bias is flattering these numbers.
But that was never the point. The point is this: the barrier to entry for understanding—and improving—a quant trading system is no longer years of study. With AI beside you, it's one step away.
And flawed as these results are, they're not a dead end—they're a starting line. A baseline to measure against, a benchmark to beat, a clear direction to push in. You're no longer staring at a blank page; you're standing on a vantage point, with somewhere to climb from here.
The dragon in the river hasn't disappeared. You've just learned to swim.


%20Gemini_Generated_Image_bouavabouavaboua.png)
%20Gemini_Generated_Image_8iiiup8iiiup8iii.png)
%20Gemini_Generated_Image_xf9qvmxf9qvmxf9q.png)


.jpg)


%20Gemini_Generated_Image_bouavabouavaboua.png)


