Below are just pure data gathered from the web.
One can make his own judgement and decision…
And, for sure this time the scale and global coverage is much bigger than the previous ones!
How did the 2008 Subprime Bubble Burst Affect the World Market?!
One Bubble after another, one crisis after another...
Count for yourself, how many are fan out from Wall Street...
Do you believe these are accidental or carefully-engineered crisis?
One Take a Look at some of the charts in Ray Dalio's Book
And the Data are stayed in 2020 when the book was published
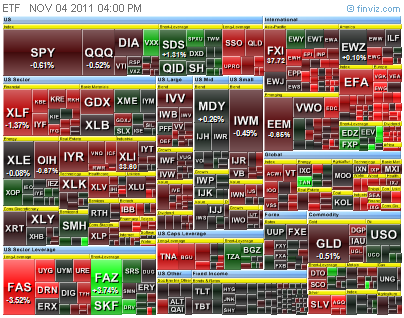
--------------------------------------------Added on 6 Nov 2025 --------------------------------------------When you are holding Gold and Silver ETFs,
do you really own Gold and Silver...???

And, this is one of the best case. What IF the price make a BIG JUMP before the institutions liquidate them??? They could go bankrupt!!! Or, with mercy, they pay you back with a negotiated price on your behalf, says 5 - 10% higher before breakout...
--------------------------------------------Added @ 21 Nov 2025--------------------------------------------
Perfect Storm
I just found a very meaningful chart from a post ..
https://lnkd.in/gtaFPH67
And added four comments on it... as follows:
Well, of course, this is just a personal opinion, if some force can push the Bitcoin upward again, then Nasdaq will go back up...
Question: IF there are really both AI and Bitcoin bubbles, what level will Nasdaq rest on after bubbles burst, at 2023 level? or with some Over-correction, then what would it be?
这个现象在中国也发生过...
当时房地产连续涨20多年的时候。。。就有好些上市公司,把股民投资在他的公司的钱去炒房地产,放在资产项目里,就能达到水涨船高的效果。。根本不会花钱去开发或研究什么新东西。。。
现在西方有些公司是代股民炒比特币。
----------------------------------------------------- Added @ 4 Mar 2026-------------------------------------------
With the Continuing Growth of Golbal Debt Burden, the current war with Iran can send Crude Oil price to go above USD100 or more in weeks... This could be the trigger for the RESET...


.jpg)