No Title


It is best for individual to use his/her own imagination to fill up the title and the dialogue boxes.
Bless You
KH Tang


“Just look at us, everything in backwards; everything is upside
down. Doctors destroy health, lawyers destroy justice,
universities destroy knowledge, governments
destroy freedom,the major media
destroy information, and
religions destroy
spirituality.”

- Michael Ellner

Going after the Real Stuffs...


The first cartoon illustrates an old story of a greyhound dog, which raced around an enclosed track chasing after a mechanical rabbit. After all that running, running and running on the same track… One day he suddenly discovered that the target that he was going after for years was not even a real rabbit! So, he quit the job.

The morale of the story remind us to think: "Are we spending our precious time going after the worthwhile goals?"

The second cartoon is basically telling the same story, but the only difference is that the one who is doing the running has not enlightened yet.

So... In today society, almost everyone is busy going after some stuffs.

And, What's the Real Stuffs?

Would you like to share your viewpoints and enlighten us, please.

Thanks. :-)

Relevant article: What If... We can know our Ultimate Goals Much Earlier?

Bless You

KH Tang

Think not only about what you want to achieve,

but also why you want to achieve it.

– Chris Taylor (Author)


The New Economy


Someone had forwarded me a hilarious story to illustrate how the US Economy works today:-

--------------------------------------------8<-------------------------------------

It is a slow day in the east Texas town of Longview. It is raining, and the little town looks totally deserted.

Times are tough, everybody is in debt and everybody lives on credit.

On this particular day, a rich tourist from the East is driving through town.

He enters the only hotel in the sleepy town and lays a hundred dollar bill on the desk stating he wants to inspect the rooms upstairs in order to pick one to spend the night.

As soon as the man walks up the stairs, the hotel proprietor takes the hundred dollar bill and runs next door to pay his debt to the butcher.

The butcher takes the $100 and runs down the street to pay his debt to the pig farmer.

The pig farmer then takes the $100 and heads off to pay his debt to the supplier of feed and fuel.

The guy at the farmer's co-op takes the $100 and runs to pay his debt to the local prostitute, who has also been facing hard times and has lately had to offer her "services" on credit.

The hooker runs to the hotel and pays off her debt with the $100 to the hotel proprietor, paying for the rooms that she had rented when she brought clients to that establishment. The hotel proprietor then lays the $100 bill back on the counter so the rich traveler will not suspect anything.

At that moment, the traveler from the East walks back down the stairs after inspecting the rooms.

He picks up the $100 bill and states that the rooms are not satisfactory, pockets the money and walks out the door and leaves town.

No one earned anything. However the whole town is now out of debt and looks to the future with a lot of optimism.

That, ladies and gentlemen, is how the United States Government is conducting business today.

What do you think....

(Author Unknown)

---------------------------------------8<-------------------------------------

Now...

One might think that though the story is interesting, but how does it related to the real world?

See...

The rich tourist is the FED, it printed the money and circulate it around and eventually goes back to him through various methods... Such as all kind of taxes that you already known, plus the invisible one-->the inflation. “Inflation is taxation without legislation.”--Milton Friedman.

And after that what happen?

There will be $100 more in the Money System.

When the FED keep doing this, they will be more and more money in the system.

(As show in Picture one... Money Supply Keep Increasing in an exponential rate!)

While the products or services can not keep up with the rate of increase...

(As show in Picture two... Depletion of finite Natural Resources, such as energy, clean water, farm land,etc., keep reducing.)

=> The Buying Power of Money keep reducing or so called Hyper Inflation.

(As show in Picture tree... Relationship of Value of Dollar Vs Money Supply.)

In the attached videos, it explains clearing how this hyperinflation can and will happen, and using the Zimbabwe case as an example. It also provides some suggestion as a solution for individual in how to deal with it... Must Watch...


By the way, the rich tourist here can be your government too. :-)

Why not take a minute to google and find out how much "Money Supply" is produce by your rich tourist last quarter?

Bless You.

KH Tang

"Inflation is always and everywhere a monetary phenomenon.

To control inflation, you need to control

the money supply."

Nobel Laureate in Economics.

Who Gain the Profits from Financial Crisis?


Attached is a short article that tell people How and Who will gain huge profit
from financial crisis. Although it was written in the 80's...

-------------------------------------------------- 8< -------------------------------------------------------
Excerpt from "Syndrome of Control" - Chapter 1 by Lindsey Williams
--------------------------------------------------------------------------------------------------------------

Farms
One-tenth of one percent of the farms in America are going into bankruptcy every thirty days. Recently, a farmer in South Dakota told me the following story. He said that his farm had been in their family for three generations. His great, great grandfather had homesteaded it. It has been successfully and profitably tended for three generations.

A few years back when land values increased considerably, the bank persuaded the farmer to purchase more land and equipment by borrowing from the bank, using his land as collateral. Then the bottom dropped out of land prices because of the economy which had been intentionally manipulated by the Internationalist. The bank came to the farmer and said that because land prices had fallen, he no longer had enough collateral to cover his loan, and even though he was current in his payments, he must pay the difference between the amount of his loan and the amount of collateral which he had to back the loan. The farmer could not come up with the amount of money the bank was demanding. Later the bank came to the farmer and announced that they were going to repossess, but the bank asked the farmer if he and his family would stay on the farm as Tenant Farmers.

Was it to the advantage of the Internationalist to bring about a financial crisis for the farmers? Yes! They got the farm for the price of the combine. If a farmer can't afford to farm without borrowing money, then he surely can't afford to farm borrowing money and paying interest. I predict that the majority of the farms of America will be corporate farms within a few years, if the Internationalists have their way.
-------------------------------------------------- 8< -------------------------------------------------------

This trick had been applied world wide... and it is now applied to all the oil production countries... and still working well. History keep repeating itself. Just that the scale and location keep changing.


As spoken in the 1st video that the Manipulator will only buy stocks at it lowest price by spending penny for value of dollars. How can this be done? Or, how can this be detected? This article, TAPE READING, would show you the clue of how to do so.

"The average man doesn’t wish to be told that it is a bull or a

bear market. What he desires is to be told specifically

which particular stock to buy or sell. He wants to

get something for nothing. He does not wish to

work. He doesn’t even wish to have to think."

--Jesse Livermore


Stock Market Tools (5) - Tape Reading

"Money is made in
Tape Reading by anticipating what is coming
-- not by waiting till it happens and going with the crowd."
Richard D Wyckoff


1. Introduction
"Tape Reading" is a classical method that uses to calculate the number of shares Accumulated or Distributed in a particular stock. It been used as one of the key tool to measure the "Internal Factor" by the Gurus, such as Jessie Livermore, Richard Wyckoff, etc... combined with other "Technical Factors" of the stocks/market.

The Proposition of how Tape Reading works is that The direction of the long term trends depends upon the amount of stock owned by and disposition of the insiders and key investors against the public. As Tape Reading can be use to deduce the Accumulation and Distribution activities, and even estimate the total percentage of shares in the insiders and key investors. Therefore it can use to deduce the price direction and level.

Those who are interested in the original detail of how to do so can find out from some old classic book, such as "Reminiscences of a Stock Operator -by Edwin Lefèvre" or "Day Trading Bible - Richard Wyckoff", etc.

2. How does Tape Reading Methodology been Evolved... Volume Based Indicators
While the "Tape Reading" methodology has be evolved over time and use in current charting indicators, it basic Proposition for the idea are the same:

A) The manipulators/ insiders must accumulate enough percentage of the shares in a particular stock before they would mark up the price for distribution.

B) The manipulators/insiders are having more information than the public, and would act before the public has notice the potential of the movement.

The direct translation of the methodology into the current charting indicator is the On Balance Volume(OBV).

The OBV calculation is basically adding the day's volume to a running cumulative total when the security's price closes up, and subtracts the volume when it closes down.

There are many other variations, such as volume weighted moving average etc... All are based on the same idea that volume should move first (or to be more exact, that the accumulation or distribution should start first), before the price would move strongly.


3. How and why does it loss it effectiveness
For those who are seriously want to find out how effective of those volume based indicators, it can check it out by doing a throughout back-test of data since the indicators inception till current date.(Which would not likely possible for individual to do so). Or to check out the results in some books. "The Encyclopedia of Technical Market Indicators, by Robert Colby" is one of a good book for doing so. (Some example backtest result -> Link)

It can be seen that all these volume-based indicators were performing wonderfully well from 60's,70's and all of a sudden, in the 80's, they lost their effectiveness as an indicator for buy and sell.

This is because there are more and more trading software available together with the Personal Computers, and computerized trading system for the big institution.

Let me explain...
For those volume based indicator that the public is using, they are mainly using the daily time-frame. So, the volume based indicator has made an assumption that the trading volumes are equally distributed in the whole day.

For the manipulators who would want to paint a picture of Accumulation, they can simple sell (distribute) the shares heavily, and just before the market is closing, they can suddenly buy back a couple of percent of what they had sold and push the price above yesterday's closing price. By doing so, all the Volume-based indicators will give false information.

One can simple do an experiment to proof this...
By collecting the one minute OBV, 15 minutes OBV, 60 minutes OBV and Daily OBV over a period of some time, say for two months. It would notice that there will be contradiction in the signals by the same indicators itself with different time frame.

In general, the shorter the time frame, the more accurate it would be. But then the problem would be that most softwares are not able to handle years of 1 minutes data (Unless the user has to write special peace of code to compress the 1 minutes OBV and load it back to match with the daily price chart.)


4. How to correct these errors and bring back it accuracy

Even so, that is to reduce the time frame down to a minute or second, there is still a problem with the accuracy in such volume based indicator. As there is one more factor that need to be consider...

As today, the market is full of trading news in all sort of controlled media...
So, when the manipulators wanted to purchase some particular shares, bad news would have came out to the public first, so that they can buy all the way down.

For the classical method, all fall in price during the transaction are considered as a distribution, while all raise in the price are considered as a accumulation. And, in the Figure 4, it shows a snap shot of the Raw data of a typical transaction. Since the Bid and Ask are very dynamic, and for some high volume stocks, it can be transacted a couple or few tens of time within a second.

So, the correct way to calculate the accumulated/distributed volume MUST take consideration of the Bid and Ask on the transacted price.

If the price is taken place on the Ask, it is a accumulation, and if the price is taken place on the Bid, it is a distribution.

When one can collect the data as such for a particular share, then... over a long period of time... he can then decode the INTERNAL CONDITION of the stock. And, it must use together with others Technical Analysis Tool to get a better timing.

For those who can understand this, it need no further explanation. So be it.

Bless You.
KH Tang

...BTW, The last chart show how the money was hidden in the stock... The manipulator are the one with deep enough pocket to go through the crash, and know exactly which one to accumulate...

--------------------------------------  Added on 10 July 2015 ----------------------------------------

Application of tape reading with modern software...
The last chart in this article - Wyckoff Schematic and Application shows the "Internal Condition" of a stock under the pool operation...

-------------------------------------------------------------------------------------------------------------

Relevant Articles:


Some Events that Create Waves in the Market

The market behavior is so strange that it mostly go the “Wrong” direction as perceived by the public. And, that cause most public, (90%), continues to lose money in feeding the financial system.

Here are two simple terms which might be interested for some, in order to know a little more why would the market often goes the different direction with their researches.

1) Triple Witching

2) Window Dressing

In the derivative market, such as option and future, when one person is making some profits, some others got to lose the money to him.

Imagine that when the market is so bearish that everyone would believe that it would continue to go down… What most public will do is to buy the “PUT” Option, which it can use margin to leverage for high benefit from the market. So… Imagine that all the public is right; this would drive the option writers, mostly by financial institutions, to have big losses or even drive them to bankrupt with a few consecutive rounds of "strike" in the targeted price.

Now, imagine that you are the financial institution, what strategies or action you are going to take???

Of course, you would want to make sure you are the one who win, and that is the whole purpose for selling the option. You would then do whatever necessary possible to ensure that the option would not strike within the expiration date! (It is up to you to imagine what necessary action it might be…)

So this create pullback from the trending market and create waves…


What Does Triple Witching Mean?
An event that occurs when the contracts for stock index futures, stock index options and stock options all expire on the same day. Triple witching days happen four times a year on the third Friday of March, June, September and December.

The impact of "triple witching" has been associated with increases in the volatility of the market. The increased volatility increases the uncertainty about prices of the underlying stocks. This phenomenon is sometimes referred to as "freaky Friday".


And, if one would to examine the market behavior around these period, it can usually find serious pullback just before these dates.


What Does Window Dressing Mean?

Performance reports and a list of the holdings in a mutual fund are usually sent to clients every quarter. To window dress, the fund manager will sell stocks with large losses and purchase high flying stocks near the end of the quarter. These securities are then reported as part of the fund's holdings.

Another variation of window dressing is investing in stocks that don't meet the style of the mutual fund. For example, a precious metals fund might invest in stocks that are in a hot sector at the time, disguising the fund's holdings, so clients really have no idea what they are paying for.

Window dressing may make a fund appear more attractive, and it can't hide poor performance for long. But, the trick is that most public do have faith with their fund managers, and hope that they are doing all the best to protect their interest as they paid the fund managers to do so... Well, things are getting more complicated in modern society, and
HOPING is definitely not a good strategy...

Bless You,
KH Tang

"It is better to be out of the market for a week or

a month than to make one wrong trade.

Stay out and your judgement

will clarify"

-Richard D. Wyckoff

Stock Market Tools (4) - "Heat Map"

(Click on the Picture to Zoom in for better clarity)


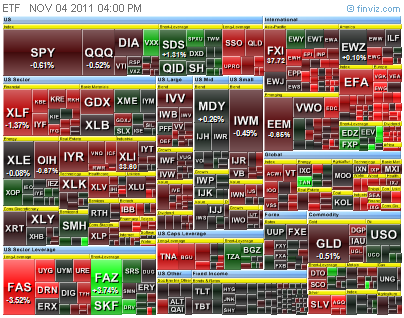
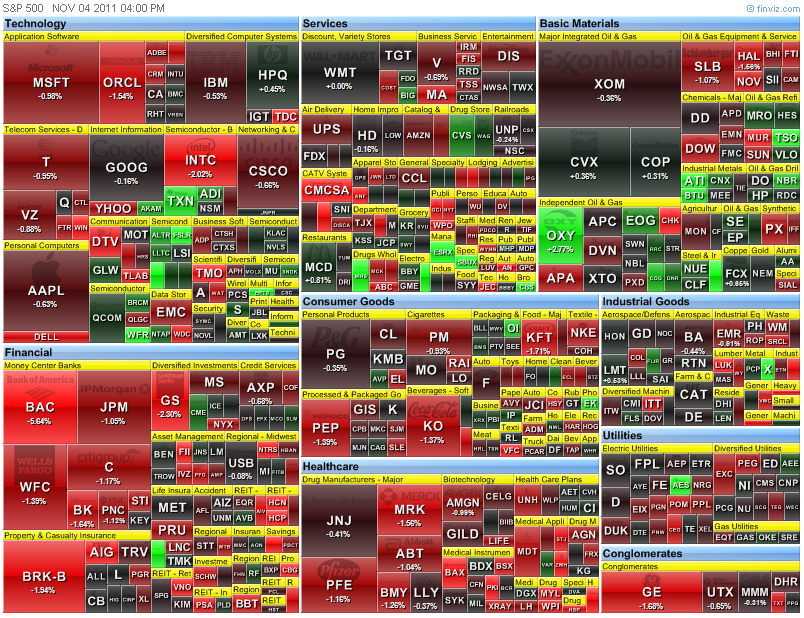
Above is a chart display the ranking of all the 100 components in Nasdaq-100, with their relative strength in terms of bull and bear. This tool was done by a gentleman, Jorgen Wallgren, and he had generously posted in the public domain formula site...
http://www.amibroker.com/library/list.php
Just get into the link and search for "Heatmap".

This tool can use to display and sort data for 4 up to 100 symbols at one time. It allows user to change the sort options, such as Change %, Volume, ADX Trend etc, and will display the data with the result and color coding.

It can use in real-time, daily, weekly, etc... to compare their relative strength at a glance.

Jorgen, thank you again for your generousity in sharing an excellent piece of work.

Bless You,
KH Tang

"Whenever I found out anything remarkable, I have thought it
my duty to put down my discovery on paper, so that all
ingenious people might be informed thereof."

What if... We Can Know Our Ultimate Goals Much Earlier?


In this compelling film,Dr. Wayne W. Dyer explores the spiritual journey from ambition

to meaning... ( https://www.youtube.com/watch?v=A0qiFzj442U )


Through his research and experience, he described that there will be a moment,
"The Shift",in a person's life that one will turn the personal value upside down...
And, there is a difference between man and women too.:-

Top value for men before The Shift:
1. Wealth (accumulation of money)
2. A sense of adventure
3. Achievement
4. The idea of pleasure
5. To be Respected.

& The Top Value for men after The Shift:
1. Spirituality
2. Personal peace
3. Family
4. God's Will (A sense of purpose)
5. Honesty


Top value for women before The Shift:
1. Family
2. A sense of Independence
3. Carrier
4. Fitting in
5. Attractiveness

& The Top Value for women after The Shift:
1. My own personal growth
2. A sense of self-esteem
3. Spirituality
4. Happiness
5. Forgivness

In the film, there are a few stories to illustrate "The Shift" taking place in our daily life.
Dr. Wayne Dyer explains that we are all living in a spiritual life, regardless wether one
aware of it or not, as it is just like timing for a person when he go through his journey
of life.
It is like, at the beginning a personal is in the Morning of his life (which he call it
the Ambition Phase, and the value system is mainly Ego based.) Later, when a person
learned or matured enough, he will move into the Afternoon of his life (which he call it
the Meaning Phase, and the value system is mainly spiritual based.)


Attached is the link to review the film: Click Here <- span="">


AND, most importantly, after watching it... it might help you to get to your ultimate
goal earlier.


A similar message from Michael Beckwith on A Spiritual Journey Through Four Stages:-
-----------------------------------------------8<------------------------------------------------- span="">
"Stage one, Victim Consciousness, finds one in constant reaction to things
happening "to me" at the hands of a power outside of our control.
Stage two, as the Manifester, you take responsibility for your life and put the
laws of the universe to work for you.
We become a third stage, Channel, when we surrender our will to a higher
intelligence that functions "through us."
Stage fourBeing Consciousness—manifests as enlightened living."
-----------------------------------------------8<------------------------------------------------- span="">

Bless You,
KH Tang


"The greatest discovery you'll ever make, is
the potential of your own mind."

— Jose Silva: was a parapsychologist and author of the Silva Method